
Gold Cycles And What To Expect - Martin Armstrong
Posted by IPM Group 5th August 2015
As we wrote here "There Is A Time To Buy And Aways A Time To Sell" recognising the cycles is all important !
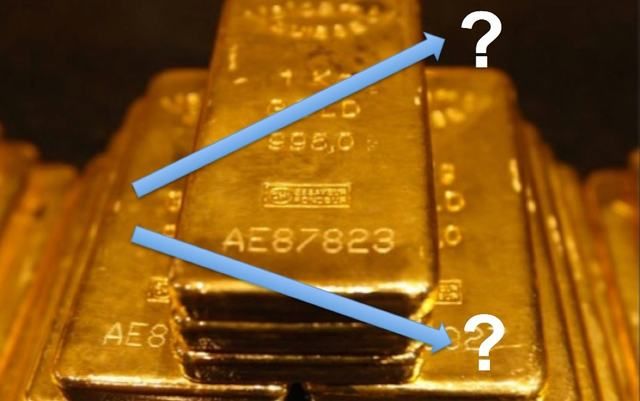
The despair, anguish and general gloom surrounding gold is all encompassing at this present time. Long-term holders of precious metals are beginning to crack and wonder why-on-earth they ever purchased gold in the first place and pessimists of the gold trade are ‘grave dancing’ with anti-gold tirades.
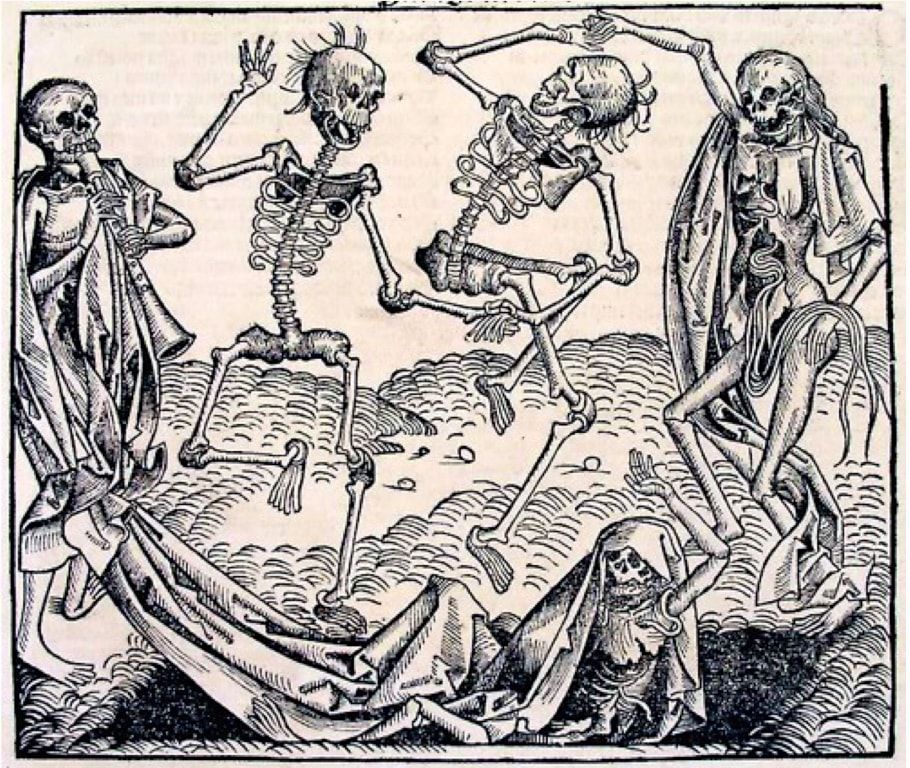
Intense grave dancing over Mr. Gold
Engraving by Michael Wolgemut
This investment market sentiment at the bottom or tops of markets I have experienced personally many times. The negative sentiment at the bottom of a major cycle is all-embracing and in turn the euphoria at the top of a major cycle is nothing short of delusional (read Chinese stock bubble or London property bubble).
But I will refrain and stop here…. Let us look at one of the most accurate forecasters these last 30 years – Martin Armstrong. His computer cycles have been built around his discovery of (aptly named) ‘Armstrong’s Economic Confidence Model’, which enabled him to make these uncannily accurate predictions based on economic cycles he had identified looking back at hundreds of years of data (reportedly going back to the birth of the Roman empire). In fact the database he has built is reported to be the largest and most in-depth databank of its kind in the world.
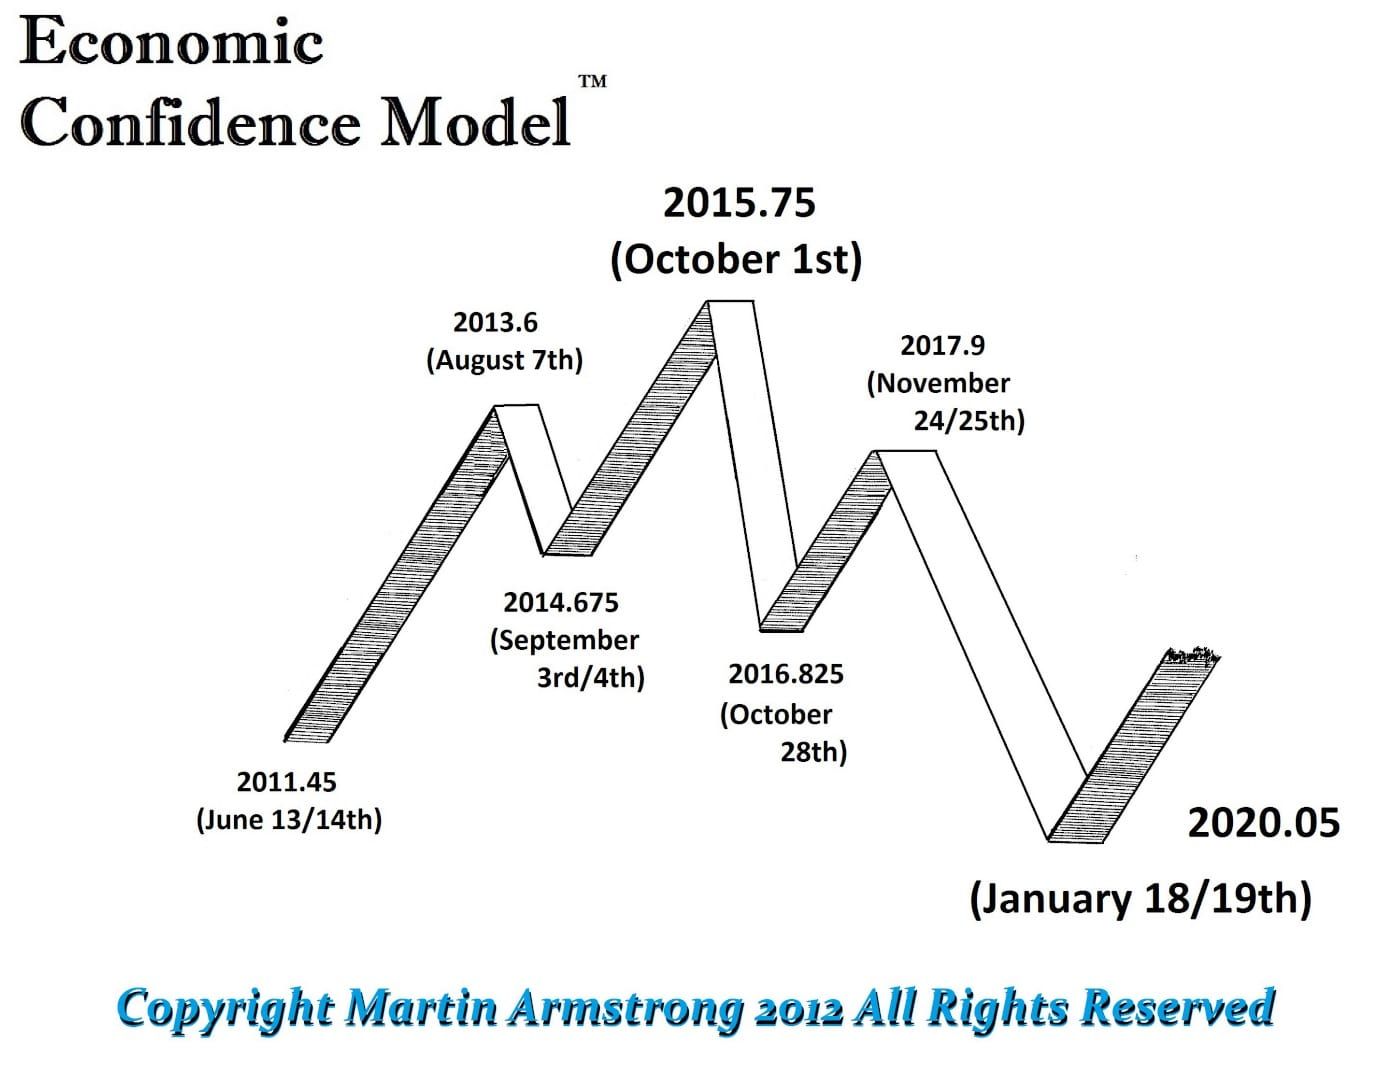
Note: Armstrong discovered he could not use the cycles based of the western calendar system as it presently stands because calendars have been re-calculated many times over the last 1,000 years. Hence they re-worked the calendar system all the way back based of numbers and integers. Hence 2015.75 means 365 days in the year / 100 * 75 = 273.75 days from Jan 1st = October 1st 2015
There was a long-term business cycle of 309.6 years, which is broken down into six waves of 51.6 years (the same duration as Russian economist Nikolai Kondratiev’s famous cycle). Armstrong then broke this wave down into six waves of 8.6 years each.
The total number of days in one 8.6 year cycle is 3,141 – pi times 1,000. Hence the model is also known as the ‘Pi Cycle’.
So what does he have to say about gold at this juncture...... (I will copy and paste his most recent articles with relevant highlights and links.) I will then follow up with a further interesting analysis on gold that rhymes very nicely indeed with Armstrong cycles.
The View on Gold and Silver posted 3rd August
QUESTION: Thanks for the latest posts.I have 2 queries if you care to consider them.
Some years ago you used to say $5000 and $12000 when contemplating gold’s upside.Now the latter seems out of reach. Can you indicate what caused you to change your mind?
Secondly, regarding a possible Republican Presidential victory, does this correlate with a USD high and, if so, why?
Many thanks & Best Regards
Bill
ANSWER: No, $5,000 is still the technical max based upon the patterns we have so far. Yes, that may change when the final low is in place. That depends upon the downward thrust for the steeper the decline, the greater the projection of that low materializing. The US$2,300 target is minimum whereas the US$5,000 is a tech target – not based upon reversals and is independent of TIME.
We need the low to see if that projection will change from $5,000. I do not expect this target to rise above $5,000, but that is entirely possible, although certainly not beyond $12,000 which is the most extreme possibility and is probably not attainable. Such a level at $12,000 appears very unlikely because the system would likely implode long before that would ever develop. If government was in control, they would be going door to door confiscating everything at gunpoint. The currency would most likely change and we would be measuring gold as something else by then.
The ultimate high depends upon the patterns creating the low – not fundamentals. We need the final low before the COMPUTER can provide that target, rather than my opinion.
We have been the highest paid firm in the world for decades. Clients want to know what the COMPUTER is forecasting, not my personal opinion. So, I could be wrong. I find it primitive when people try to criticize me personally for it only shows their own ignorance. My opinion does not matter. I cannot wait for the day to retire and let them all argue against the COMPUTER. It is similar to politicians claiming, “Vote for me because I lie less than my opponent!” They remain trapped in a primitive world and cannot see the global connections. NO ONE can forecast the future based upon fundamentals and personal perspectives. That is in the category of a witch doctor. We need the COMPUTER to remove the bias and prejudice. It is what it is – nothing more. You cannot be an analyst and married to a predetermined view regardless of what the instrument might be. Everything rises, falls, and rises again with TIME.
When the low comes into place, then the COMPUTER will provide the projection for the high. We will have to see what comes out. The $5,000 number was exactly what I have been saying all along. That is a projection based upon technical analysis ONLY. It is not the COMPUTER’S forecast since we first have to achieve the low.
As far as a Republican victory, it is independent of a dollar high. We are looking at a meltdown regardless of who wins. The dollar high is simply that the debt crisis begins in Europe, manifests in Japan, and finally it hits the USA last. This is how it unfolded for the 1930s. The USA has the biggest federal debt, but the taxes are lower than Europe. The disposable income in Europe is far less than in the States, so there is less room for government to keep up this insane austerity that only support bondholders.
Gold – What Now? Posted 3rd August
Gold elected the Monthly Bearish at 1155 and we did so well below that level, holding the 1084 number both weekly and monthly. Our energy models are turning positive, so it does not appear that we will have major follow-through at this time. When you elect a Bearish Reversal that far from the number, you typically bounce back to retest it before proceeding further.
We have a Directional Change back to back for August, September, and July. So, we may see a reaction to the upside to flush out the shorts since we have excessive bearishness building in the press, as the WSJ commented that gold is the “pet rock”.
A reaction rally at this point BEFORE new lows will relieve the short positions, but this is not likely to last beyond September. Therefore, we are more likely than not going to see the final decline stage into the Benchmarks. Gold is within the channel so the resistance is forming at the 1155 level followed by 1225-1300. Support will remain at 1084 on a closing basis with key support at 900.
IPM Group - Conclusion and further analysis
Ok, so according to Armstrong's computer generated cycles we are now very close in Time to completing this large correction in the Gold price which has been over 3 years in the making. We are about to start the first real bull market in Gold (in his words) with the price of the metal rising in all world currencies.
The final downside spike from here (US$ 1,080) is looking at between 15 % to 20 % ? in US$ terms - remember this is very important as US$ is appreciating against all world currencies and hence purchasing Gold in Sing$ or Myr or any other particular currency, you could see actual gains from here against the purchasing currency (lows already seen ?).
Armstrong is talking about a substantial appreciation of the US$ going into this crisis from now into 2016 and early 2017.
Upside to Gold is between more than doubling your money from here (wealth preservation indeed) and up to 5 times (or more?) over the period of the cycle.
This is not sensationalism, I am just clearly defining the paramaters in which his cycles (which have been incredibly accurate) are dictating.
As Armstrong Cycles stated...
From the longer-term perspective, gold rallied perfectly in line with our long-term cyclical models bottoming in 19 years during 1999 following the 1980 high at $875. From there, Gold rallied for 13 years, which was also precisely on track establishing the highest annual closing at $1675.80 in 2012 with the intraday high remaining during the previous year 2011 at $1920.80 in line with the low in the Economic Confidence model.
Switching into a long-term perspective gold is poised for its final high on this run in the year 2032. New highs should also be seen in 2017 and 2020 against the US$ from cycle lows in 2015. Panic Cycle Models suggest that higher volatility is due the year of 2017.
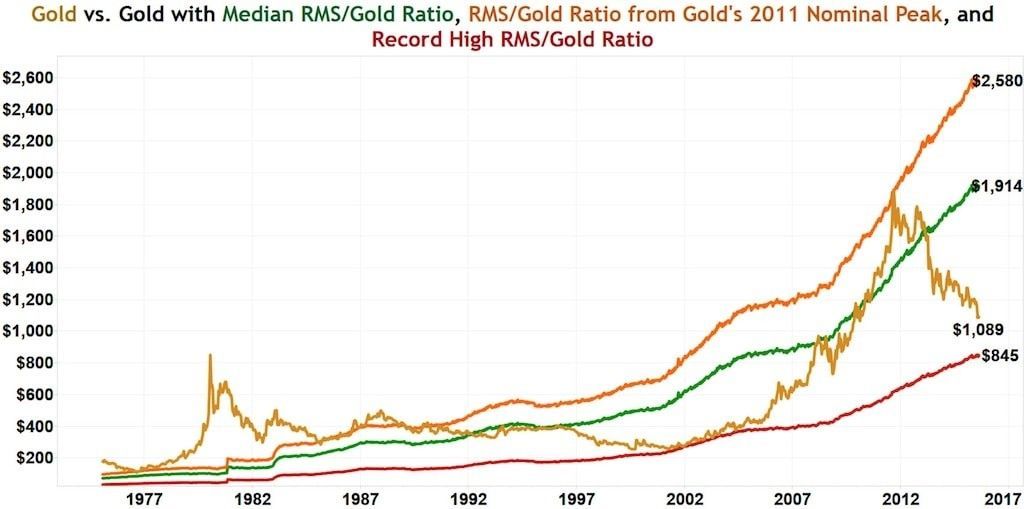
Further Analysis ...Something passed my inbox which piqued my interest on behalf of further gold analysis......Please see their link here by the NIA which have posted some nice charts.
Protect your wealth; invest in physical gold, silver or other precious metals at best prices from Indigo Precious Metals. Physical delivery in Singapore, Malaysia or safe storage at Free port Singapore.


